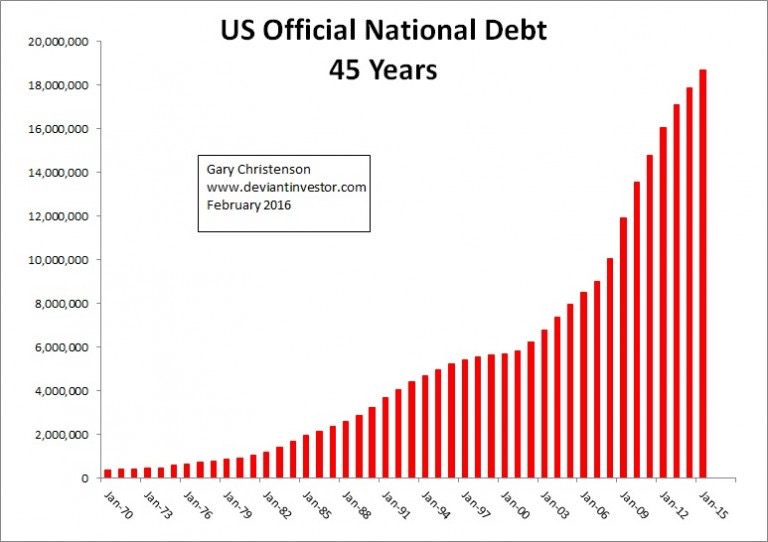
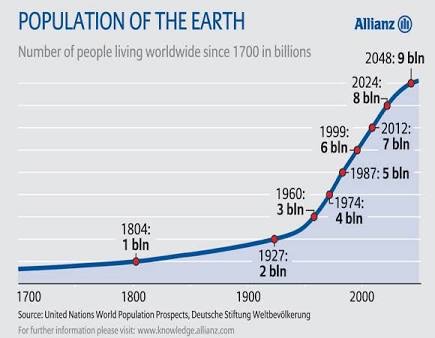
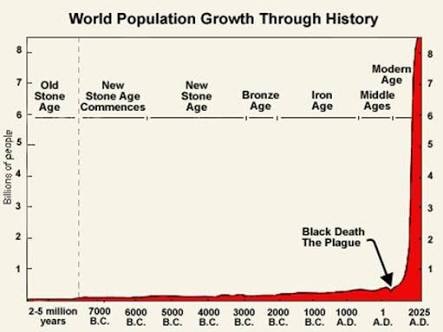
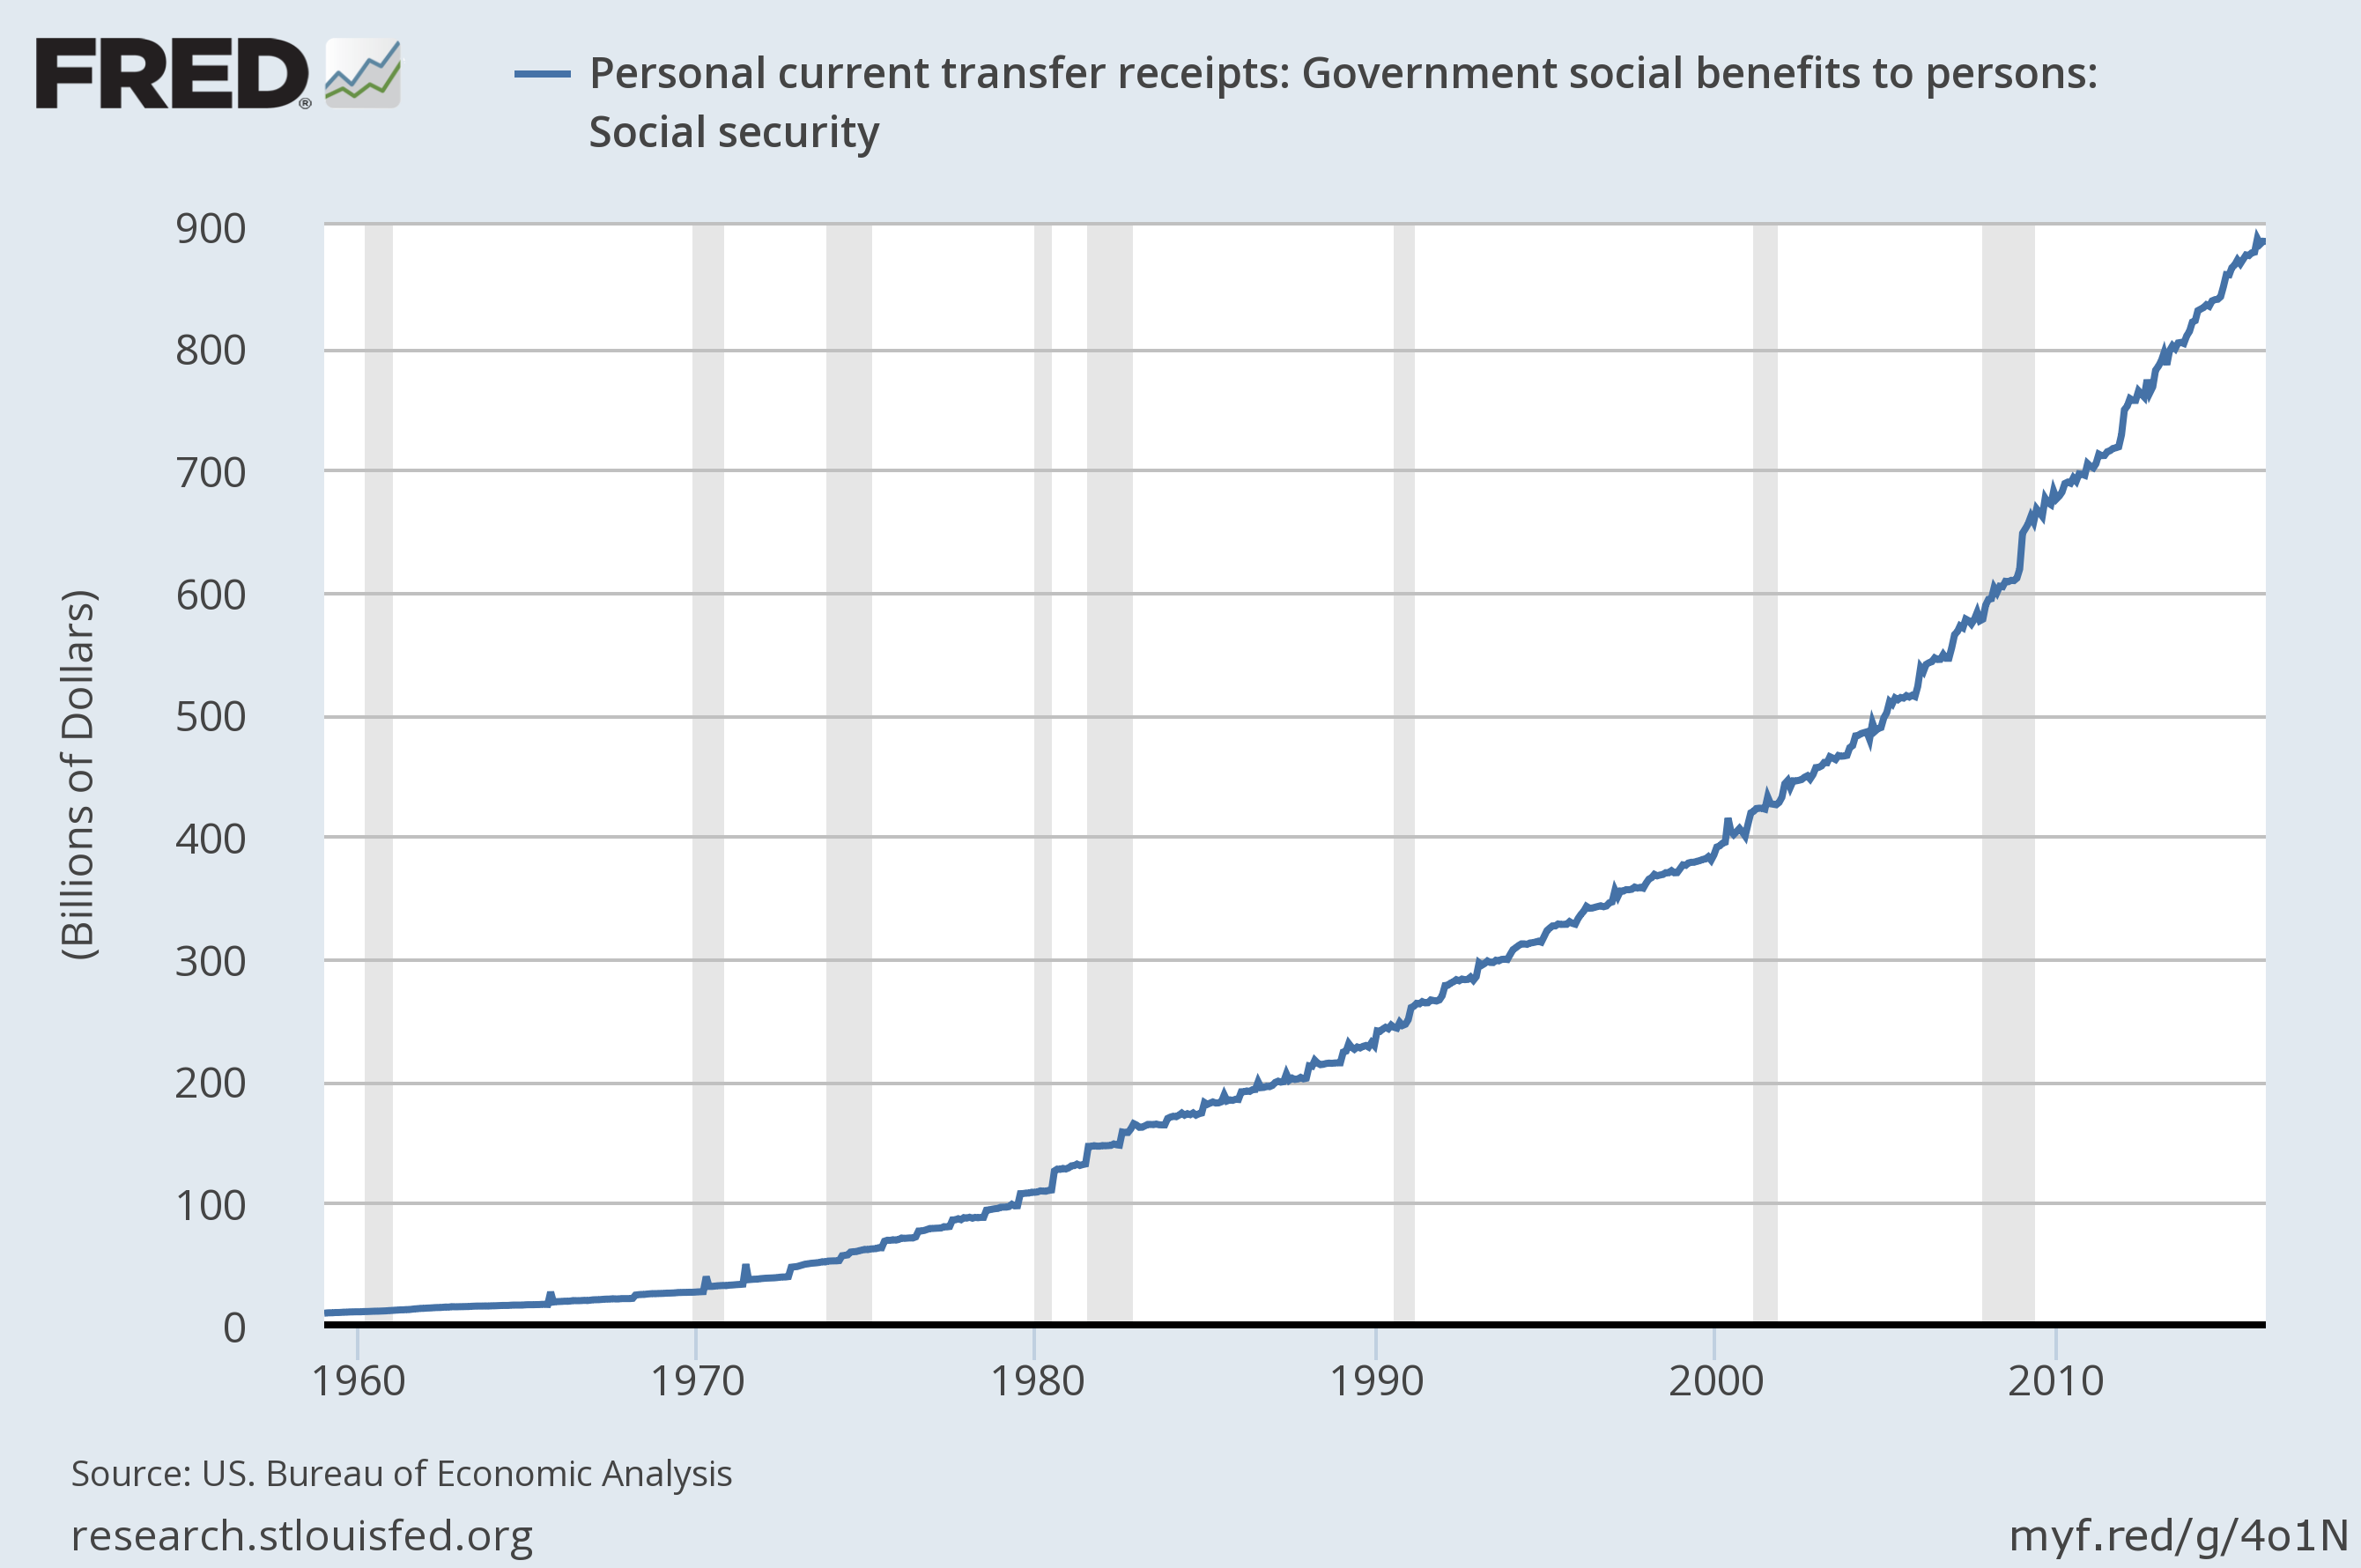
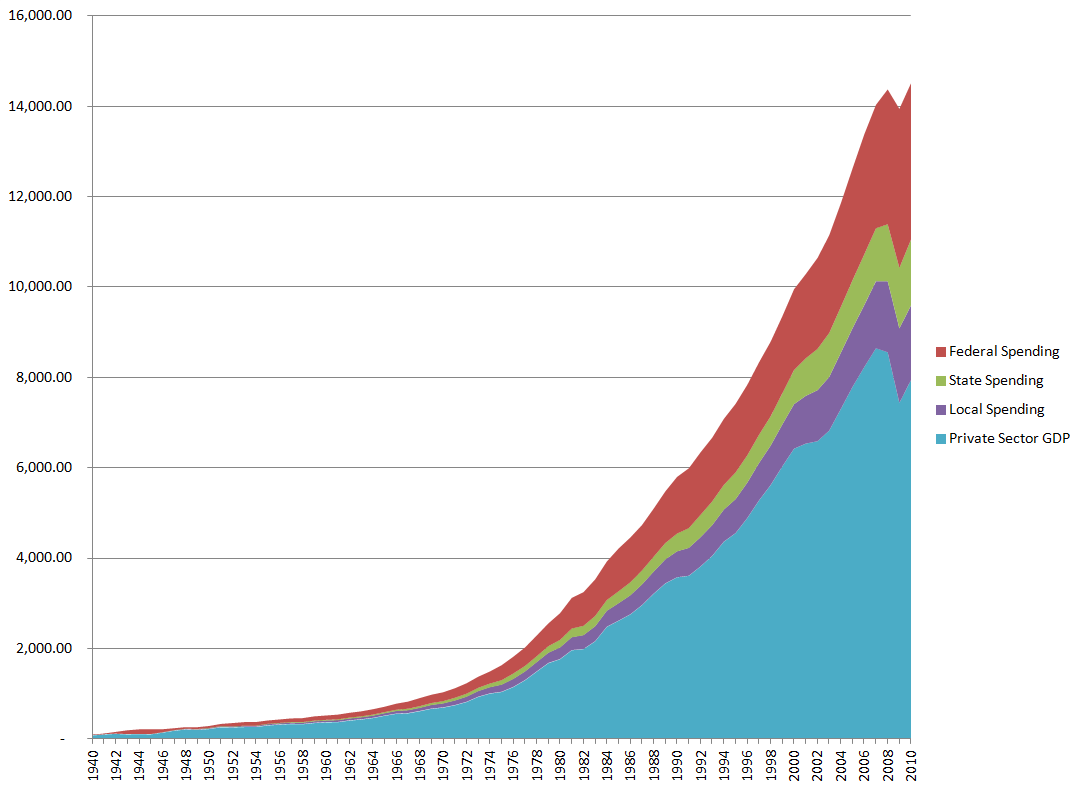
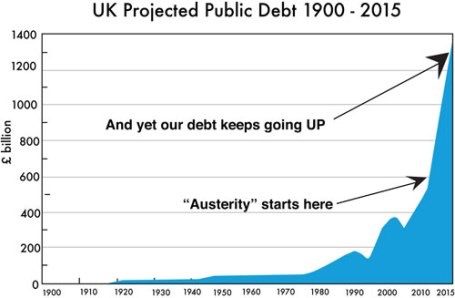
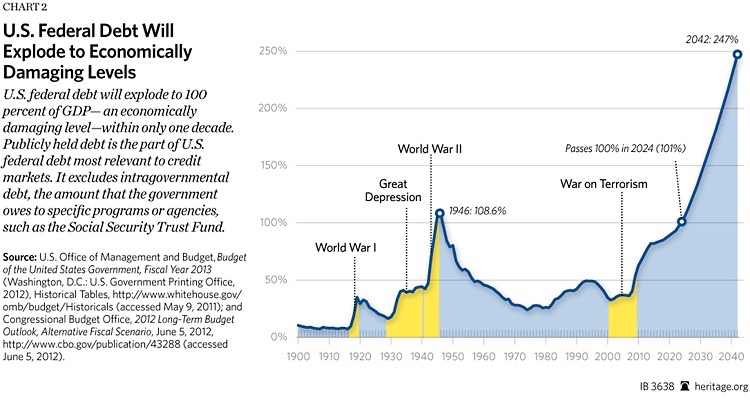
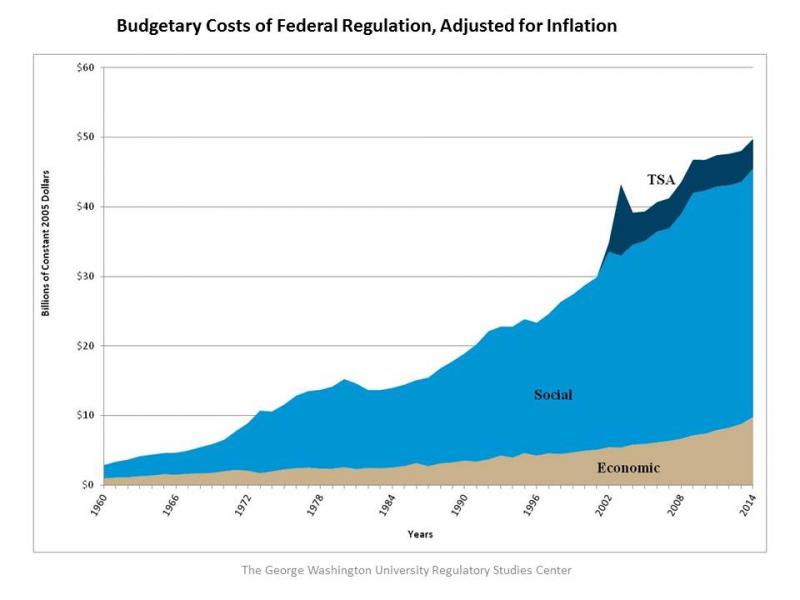
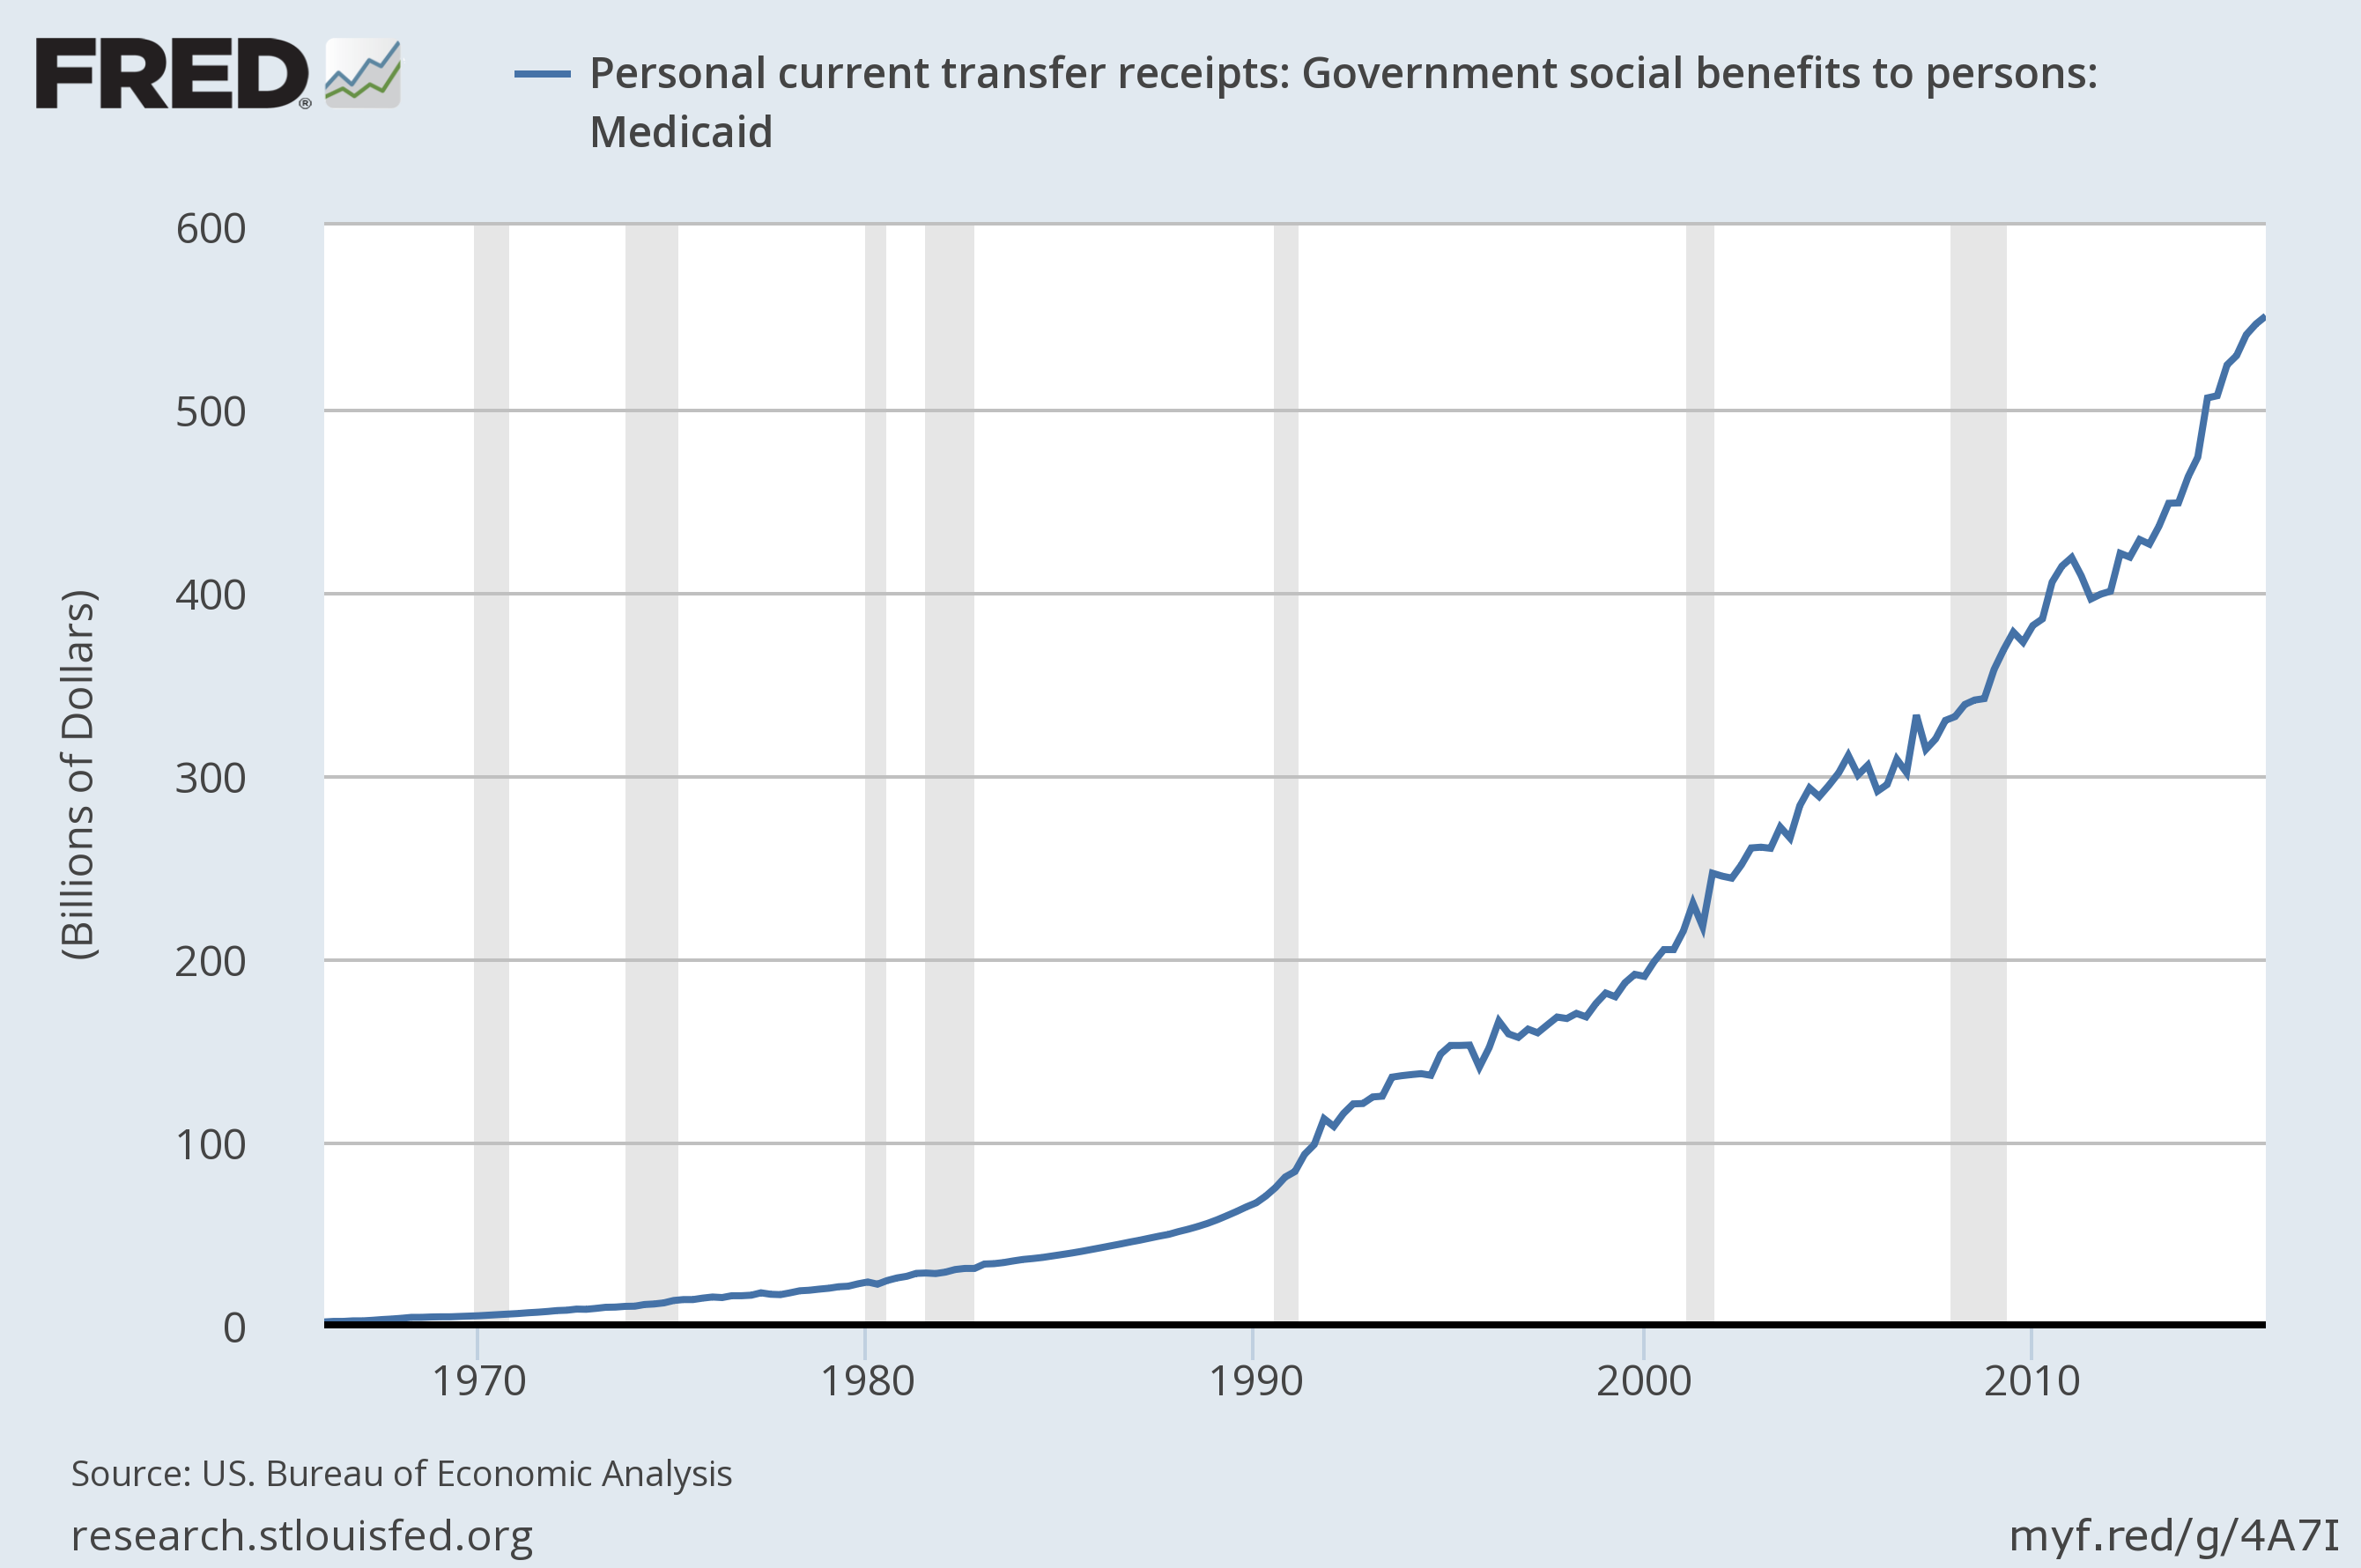
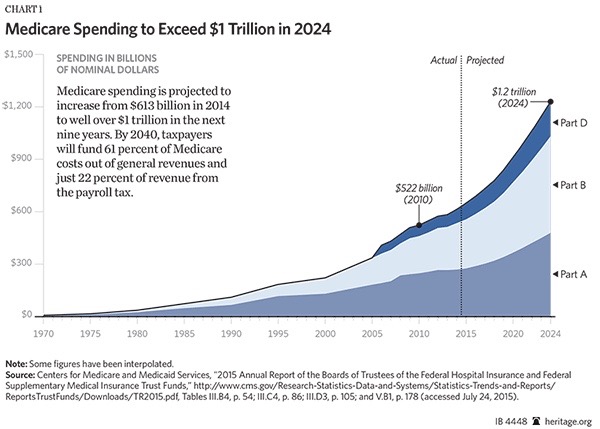
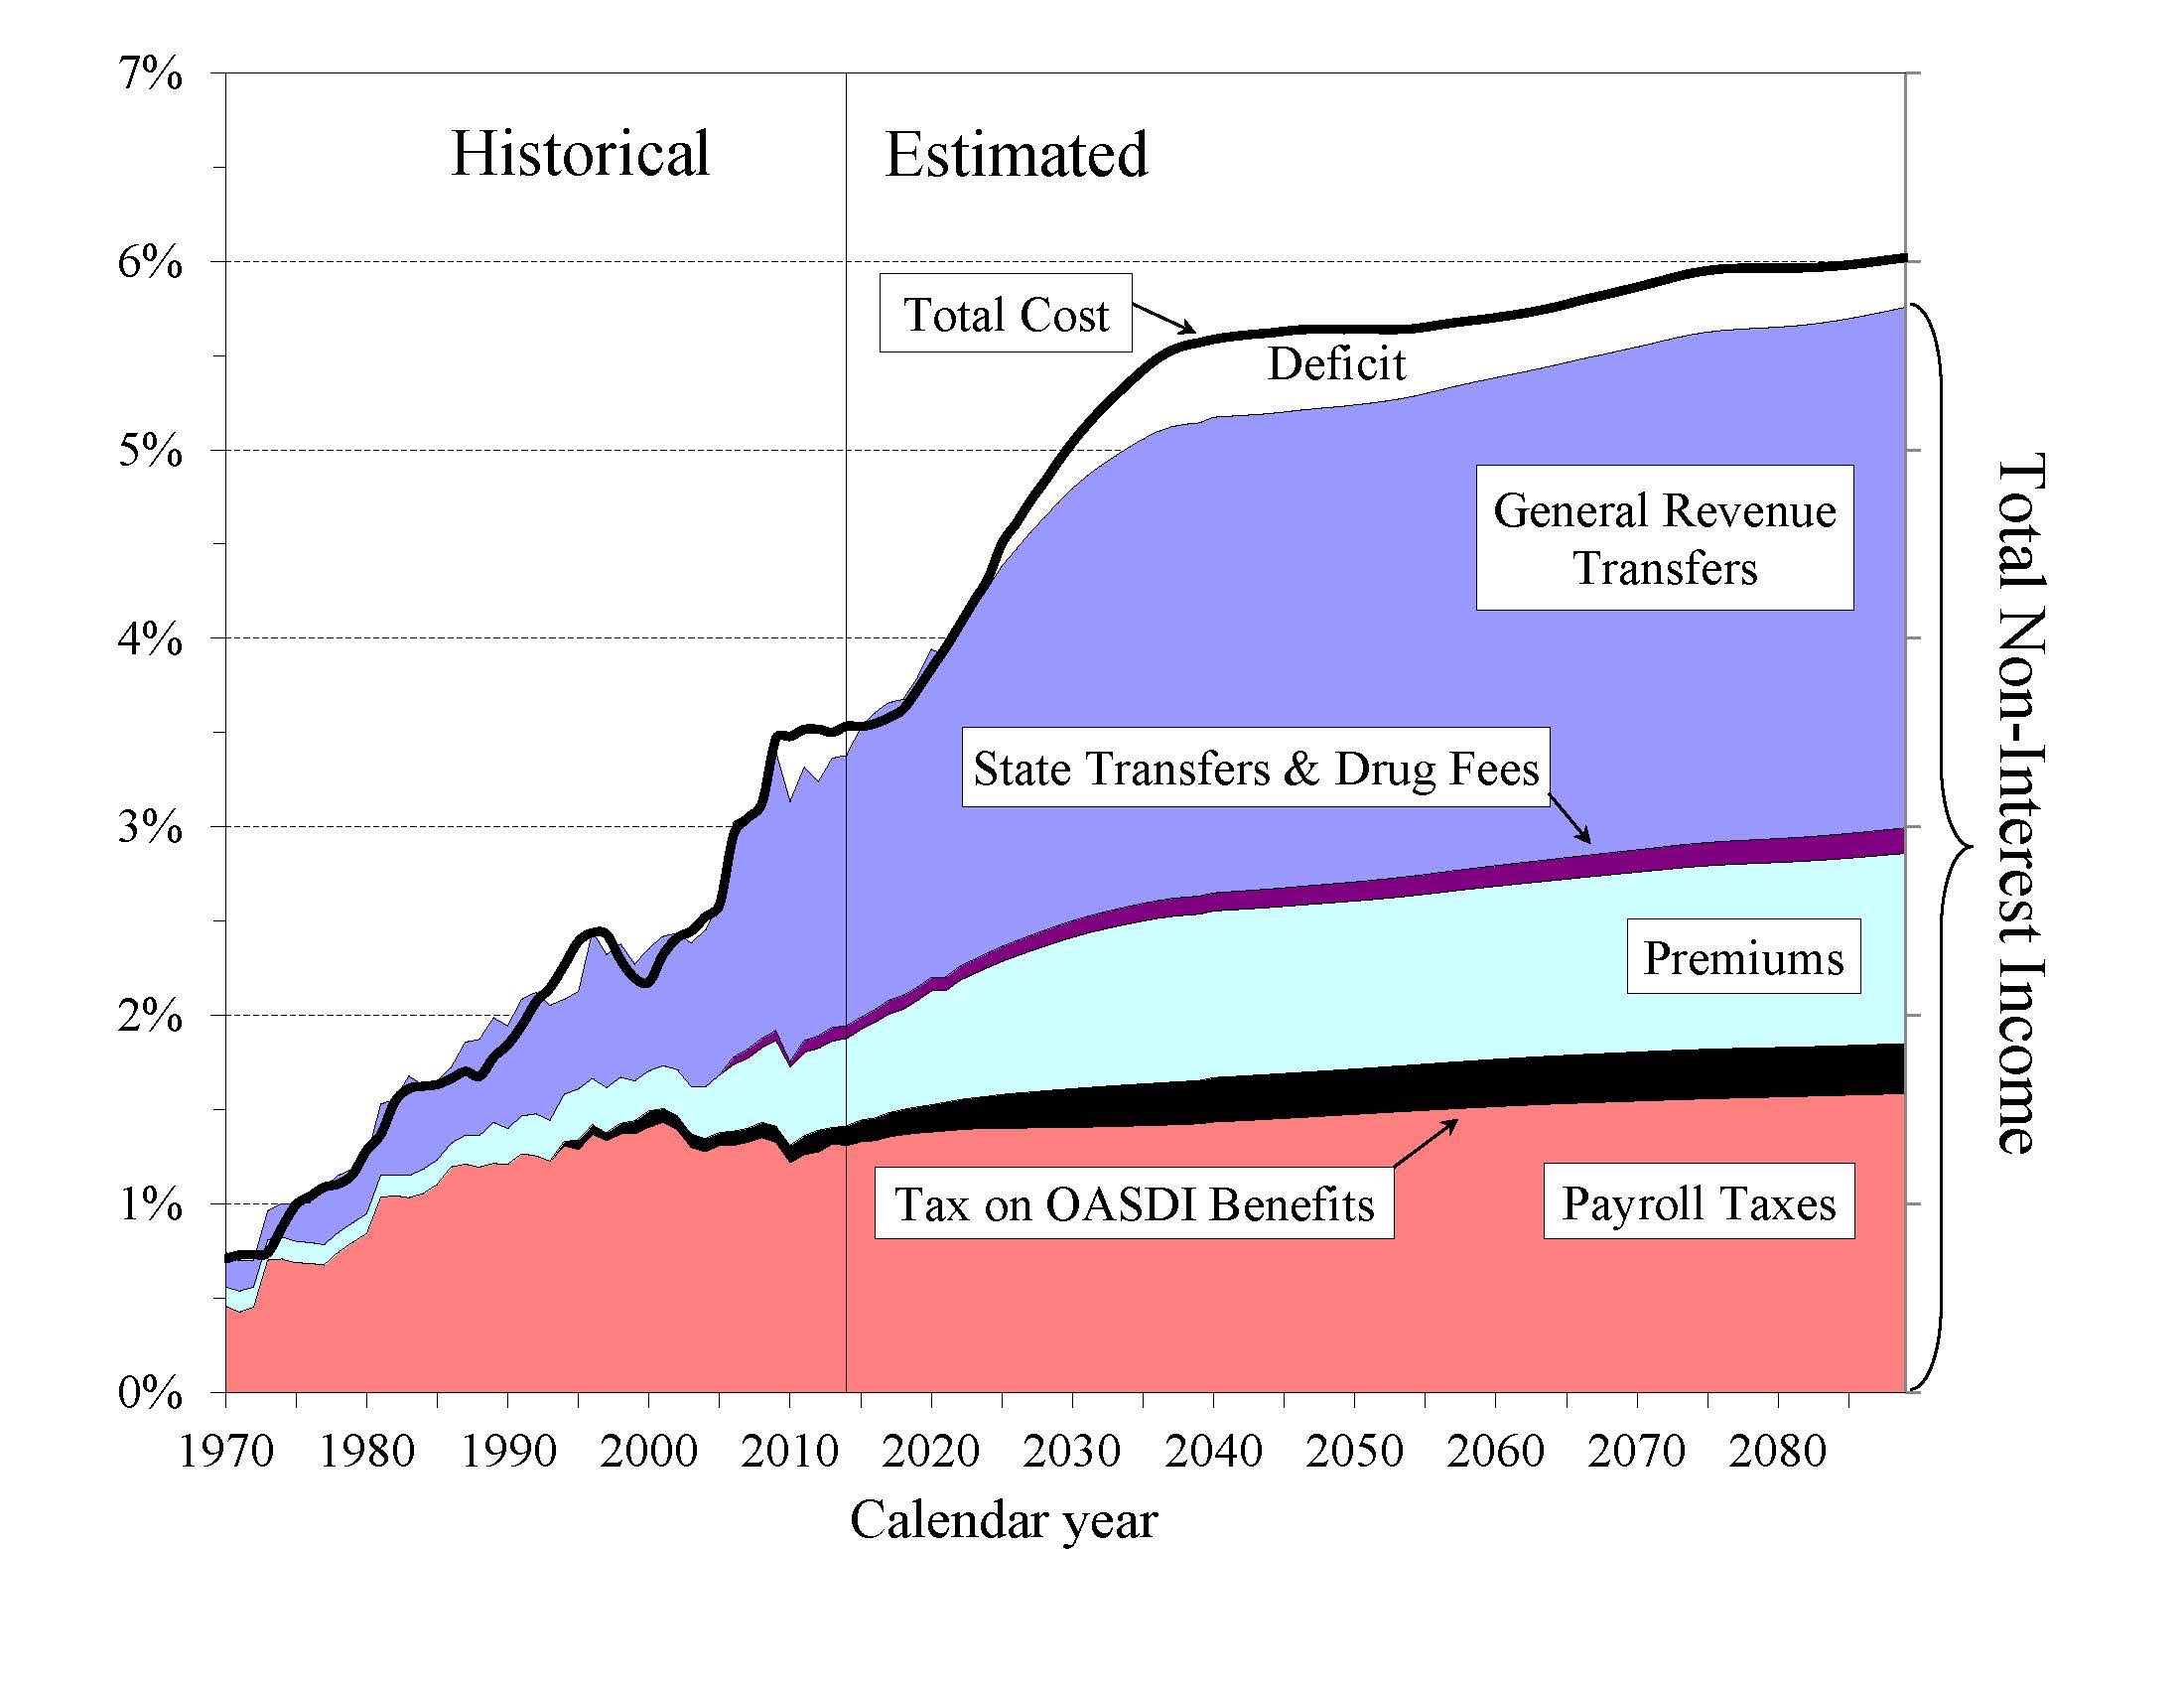
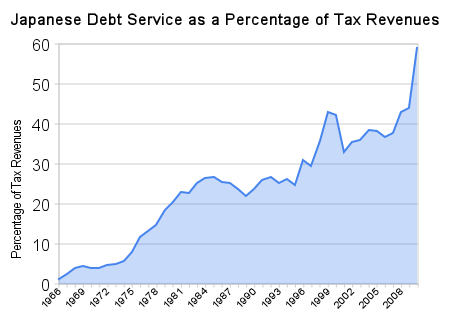
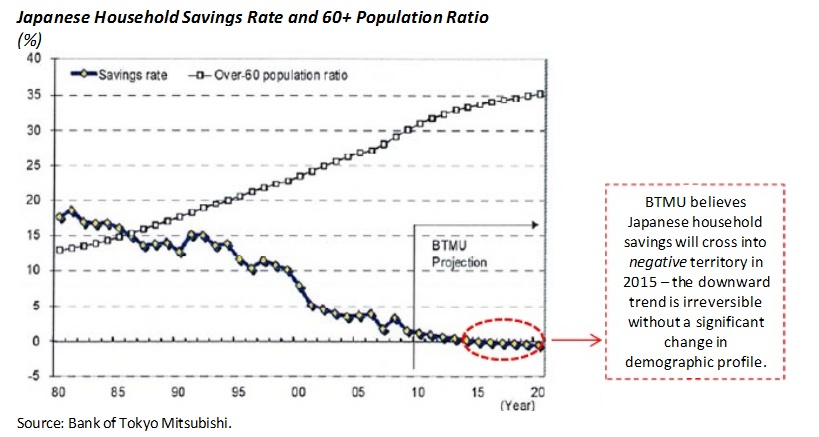
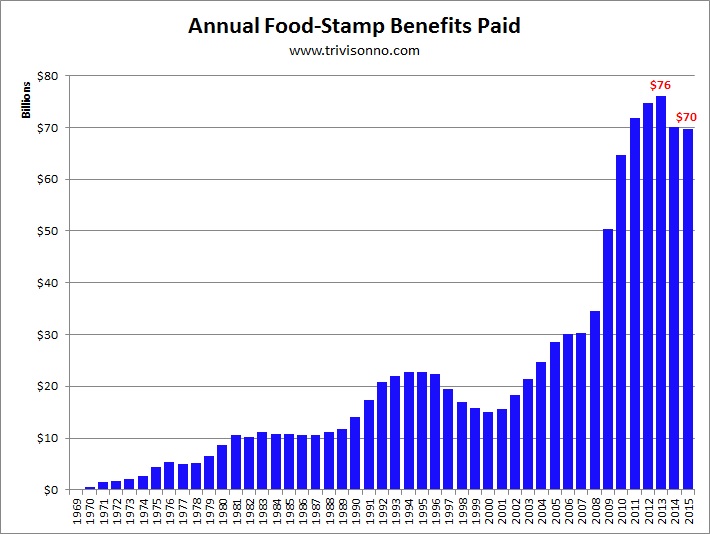
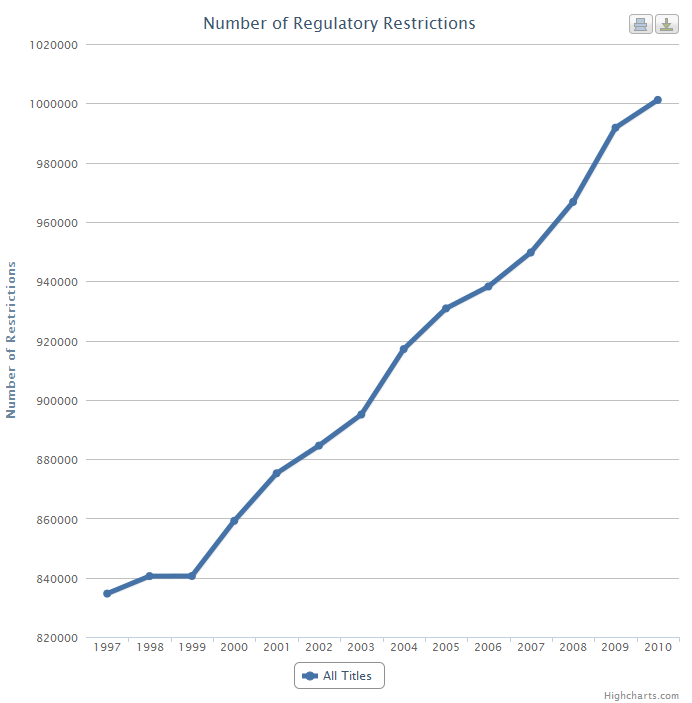
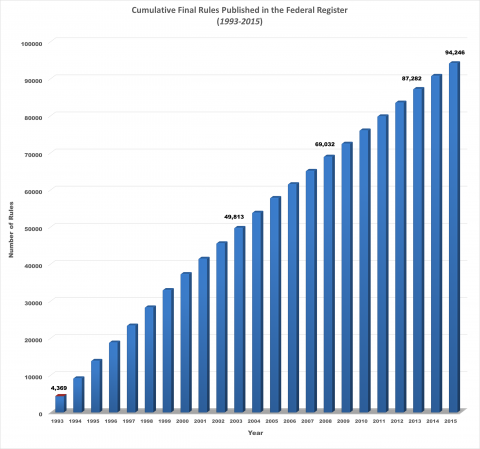
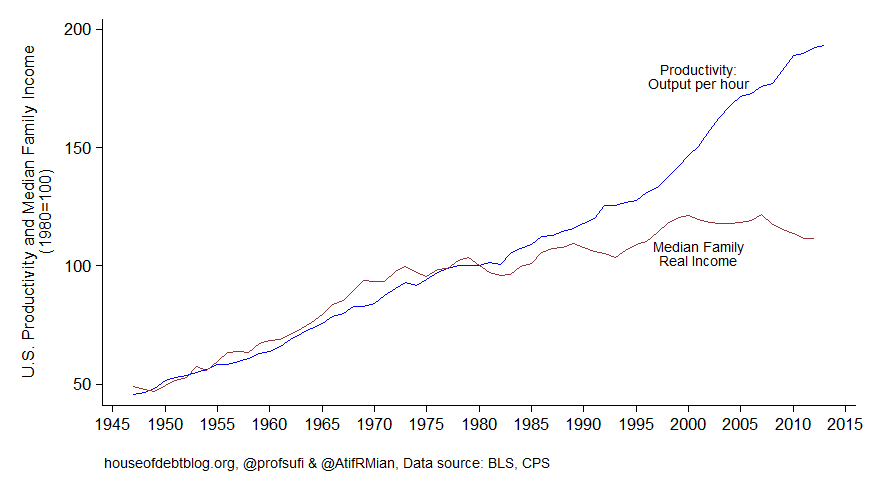
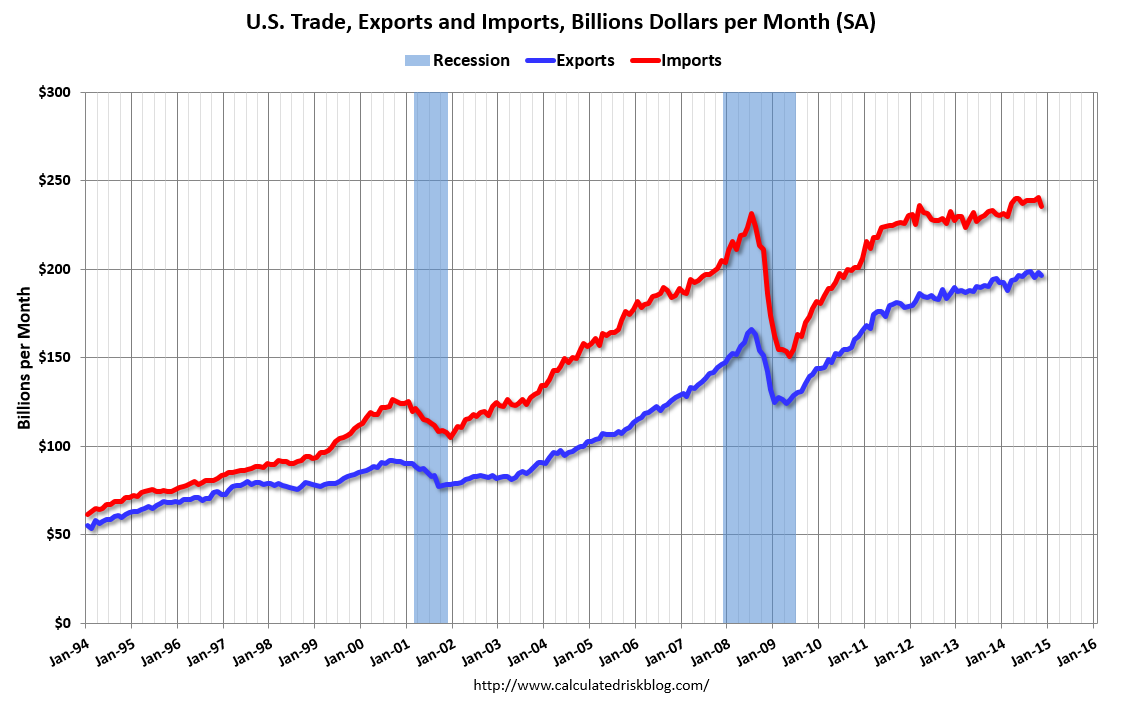
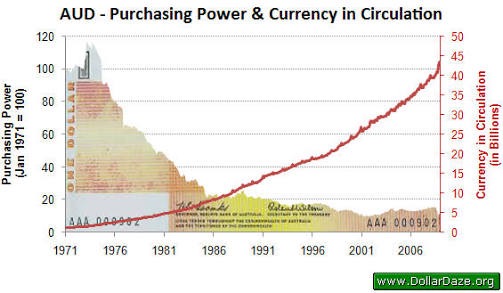
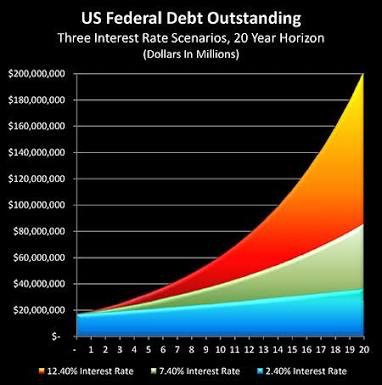
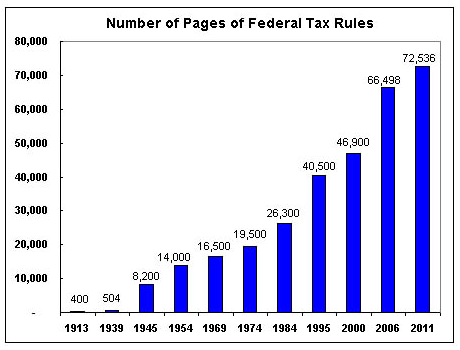
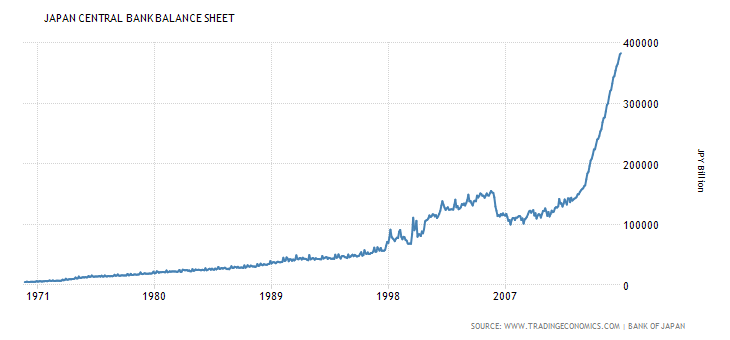
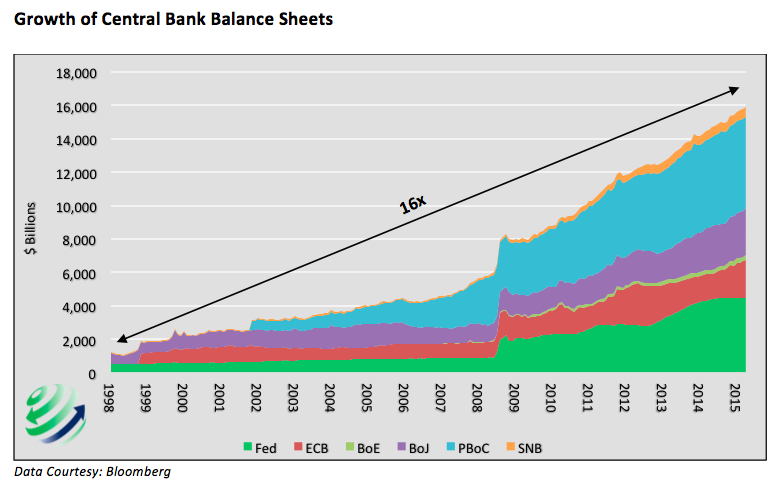
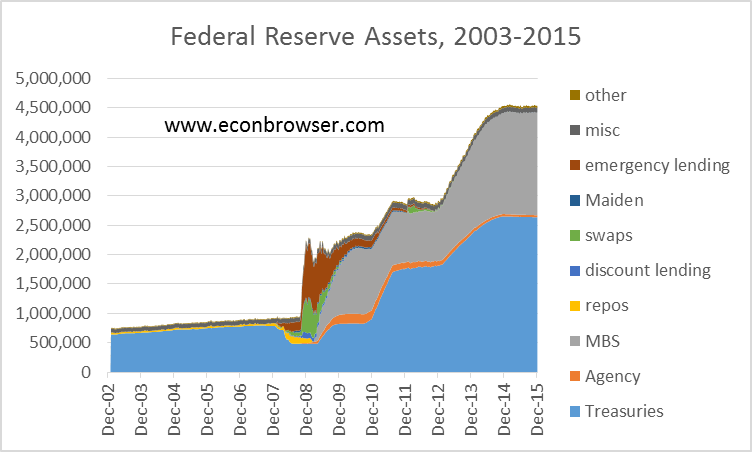
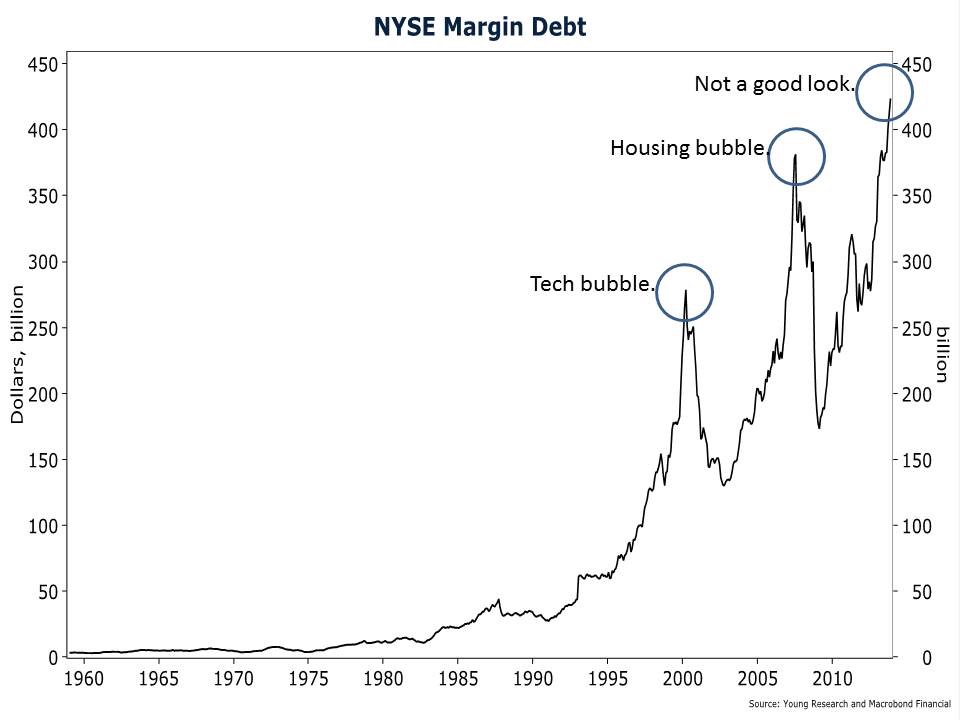
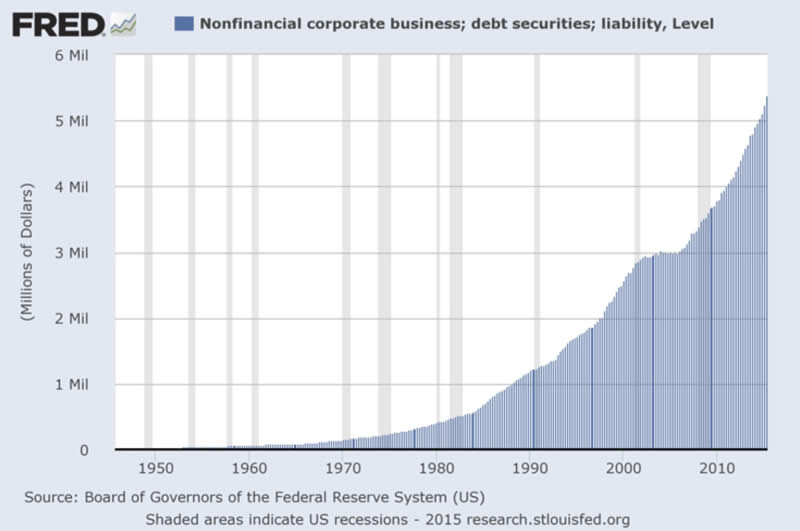
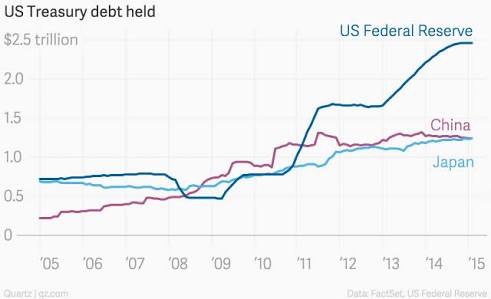
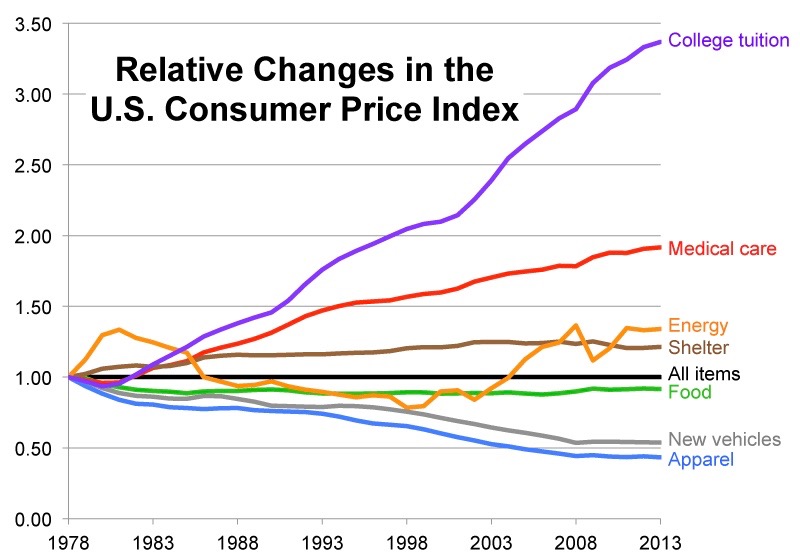
Exponential Growth Charts


Spending total 1940-2010 IMG_0465 IMG_0444 028-08282015-CBO-2013-Long-Term-4 Budgetary Cost of federal regulation, gwu Medicade IMG_0466 IMG_0436 IMG_0426 Disability Key Figures Student Loans IMG_0337 copy IMG_0164 cp-household-debt-breakdown total-US-debt IMG_0333 IMG_0124IMG_0301 IMG_0300Social Security fredgraphsamewithallparty

Inequality1 inequality


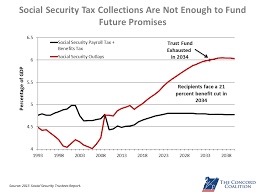
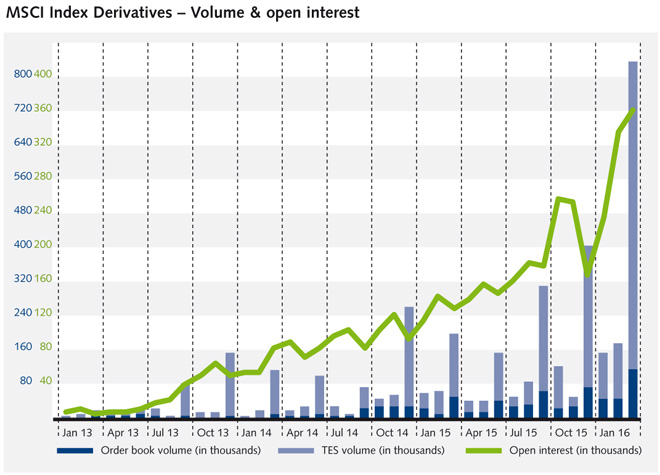
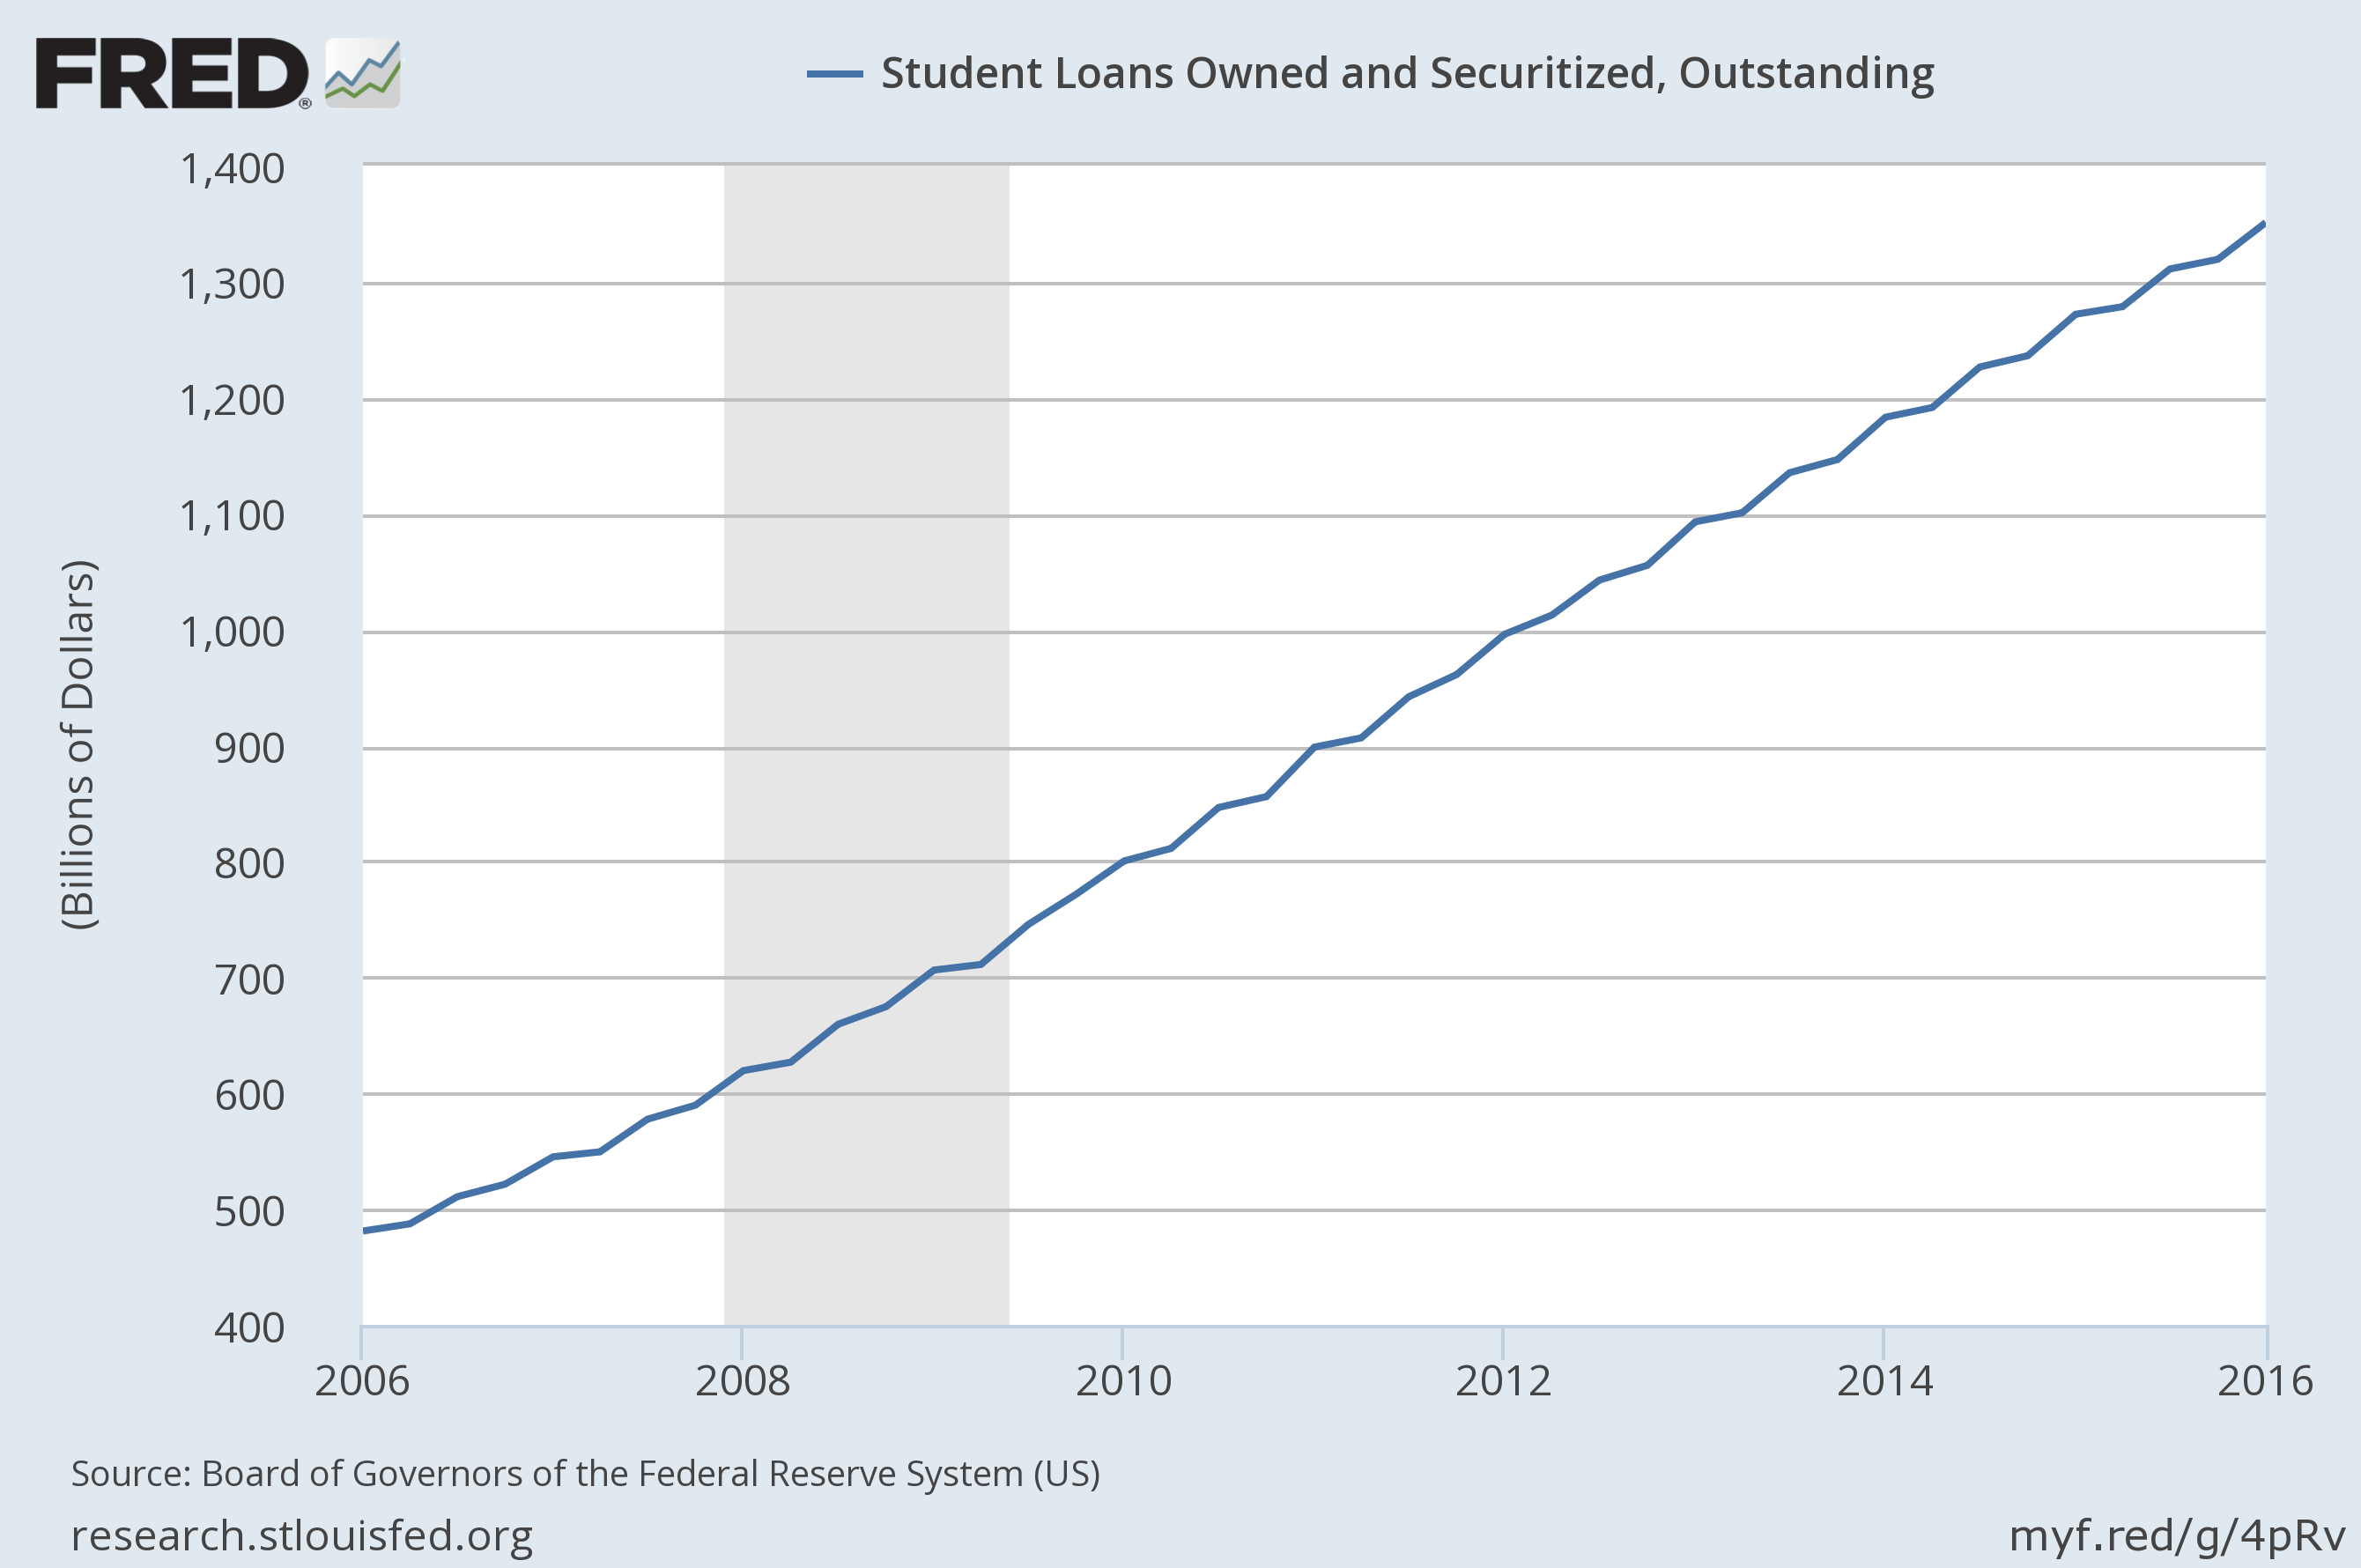
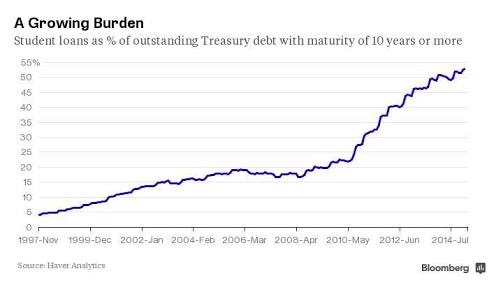
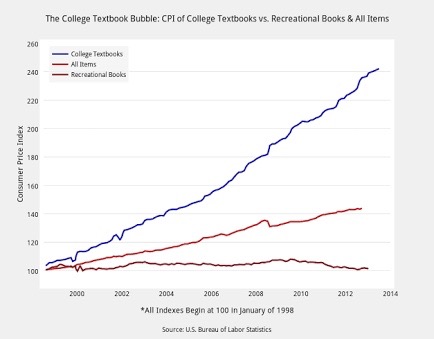
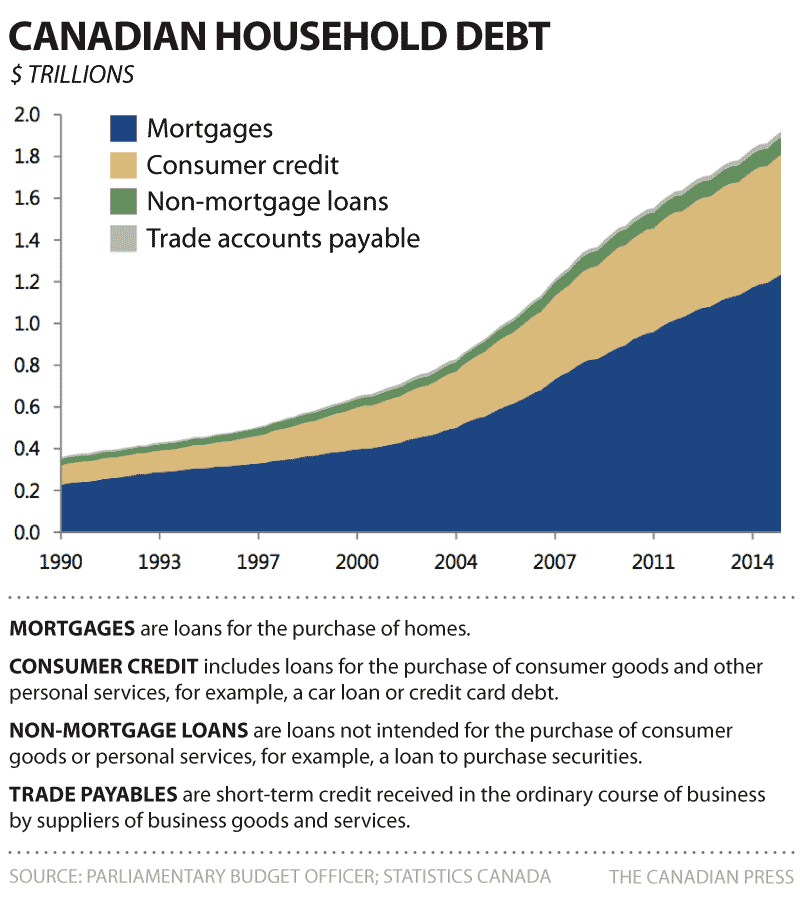
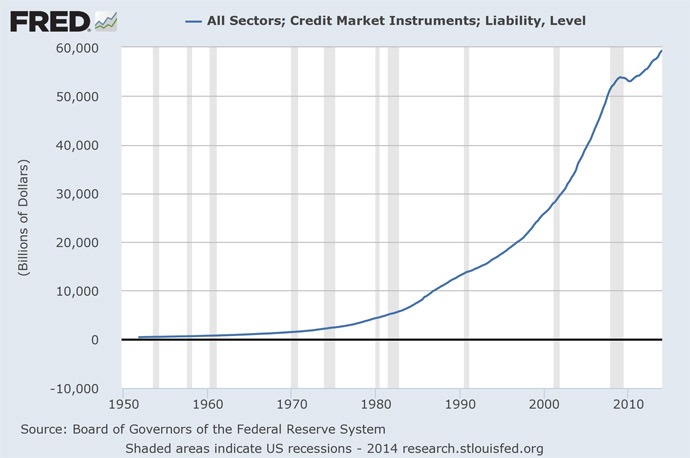
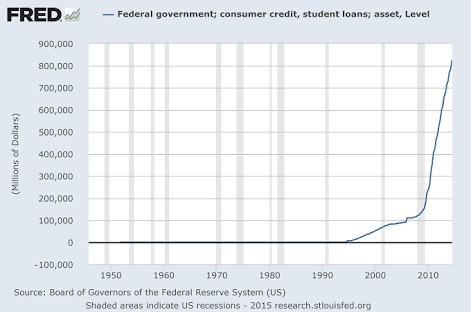
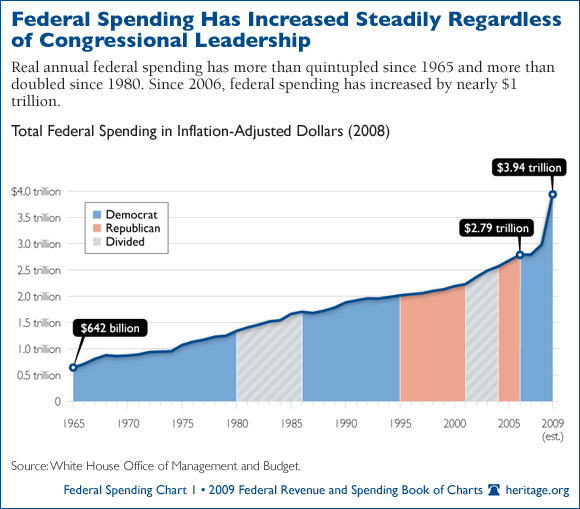
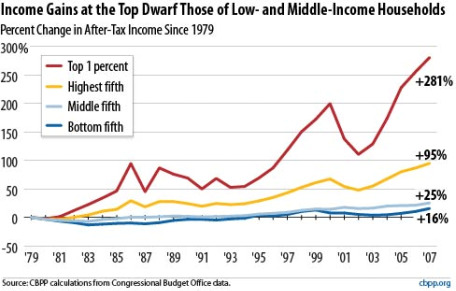
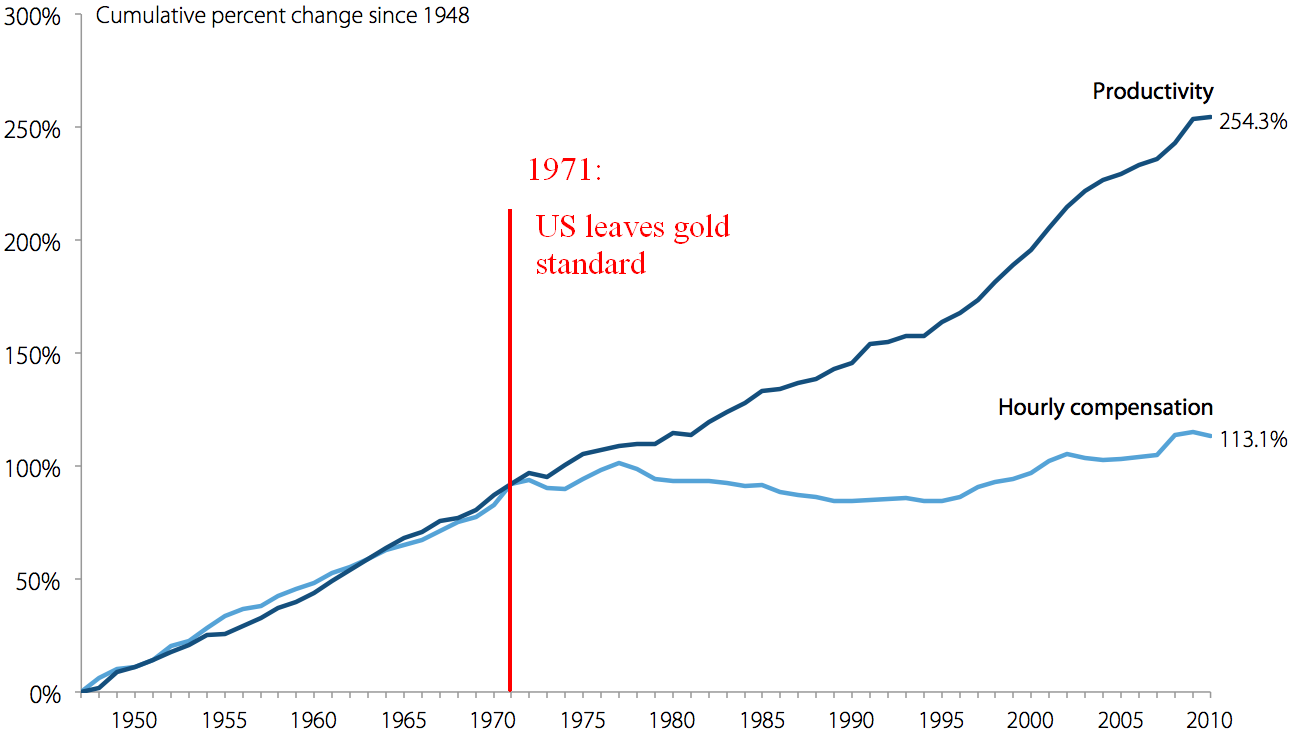
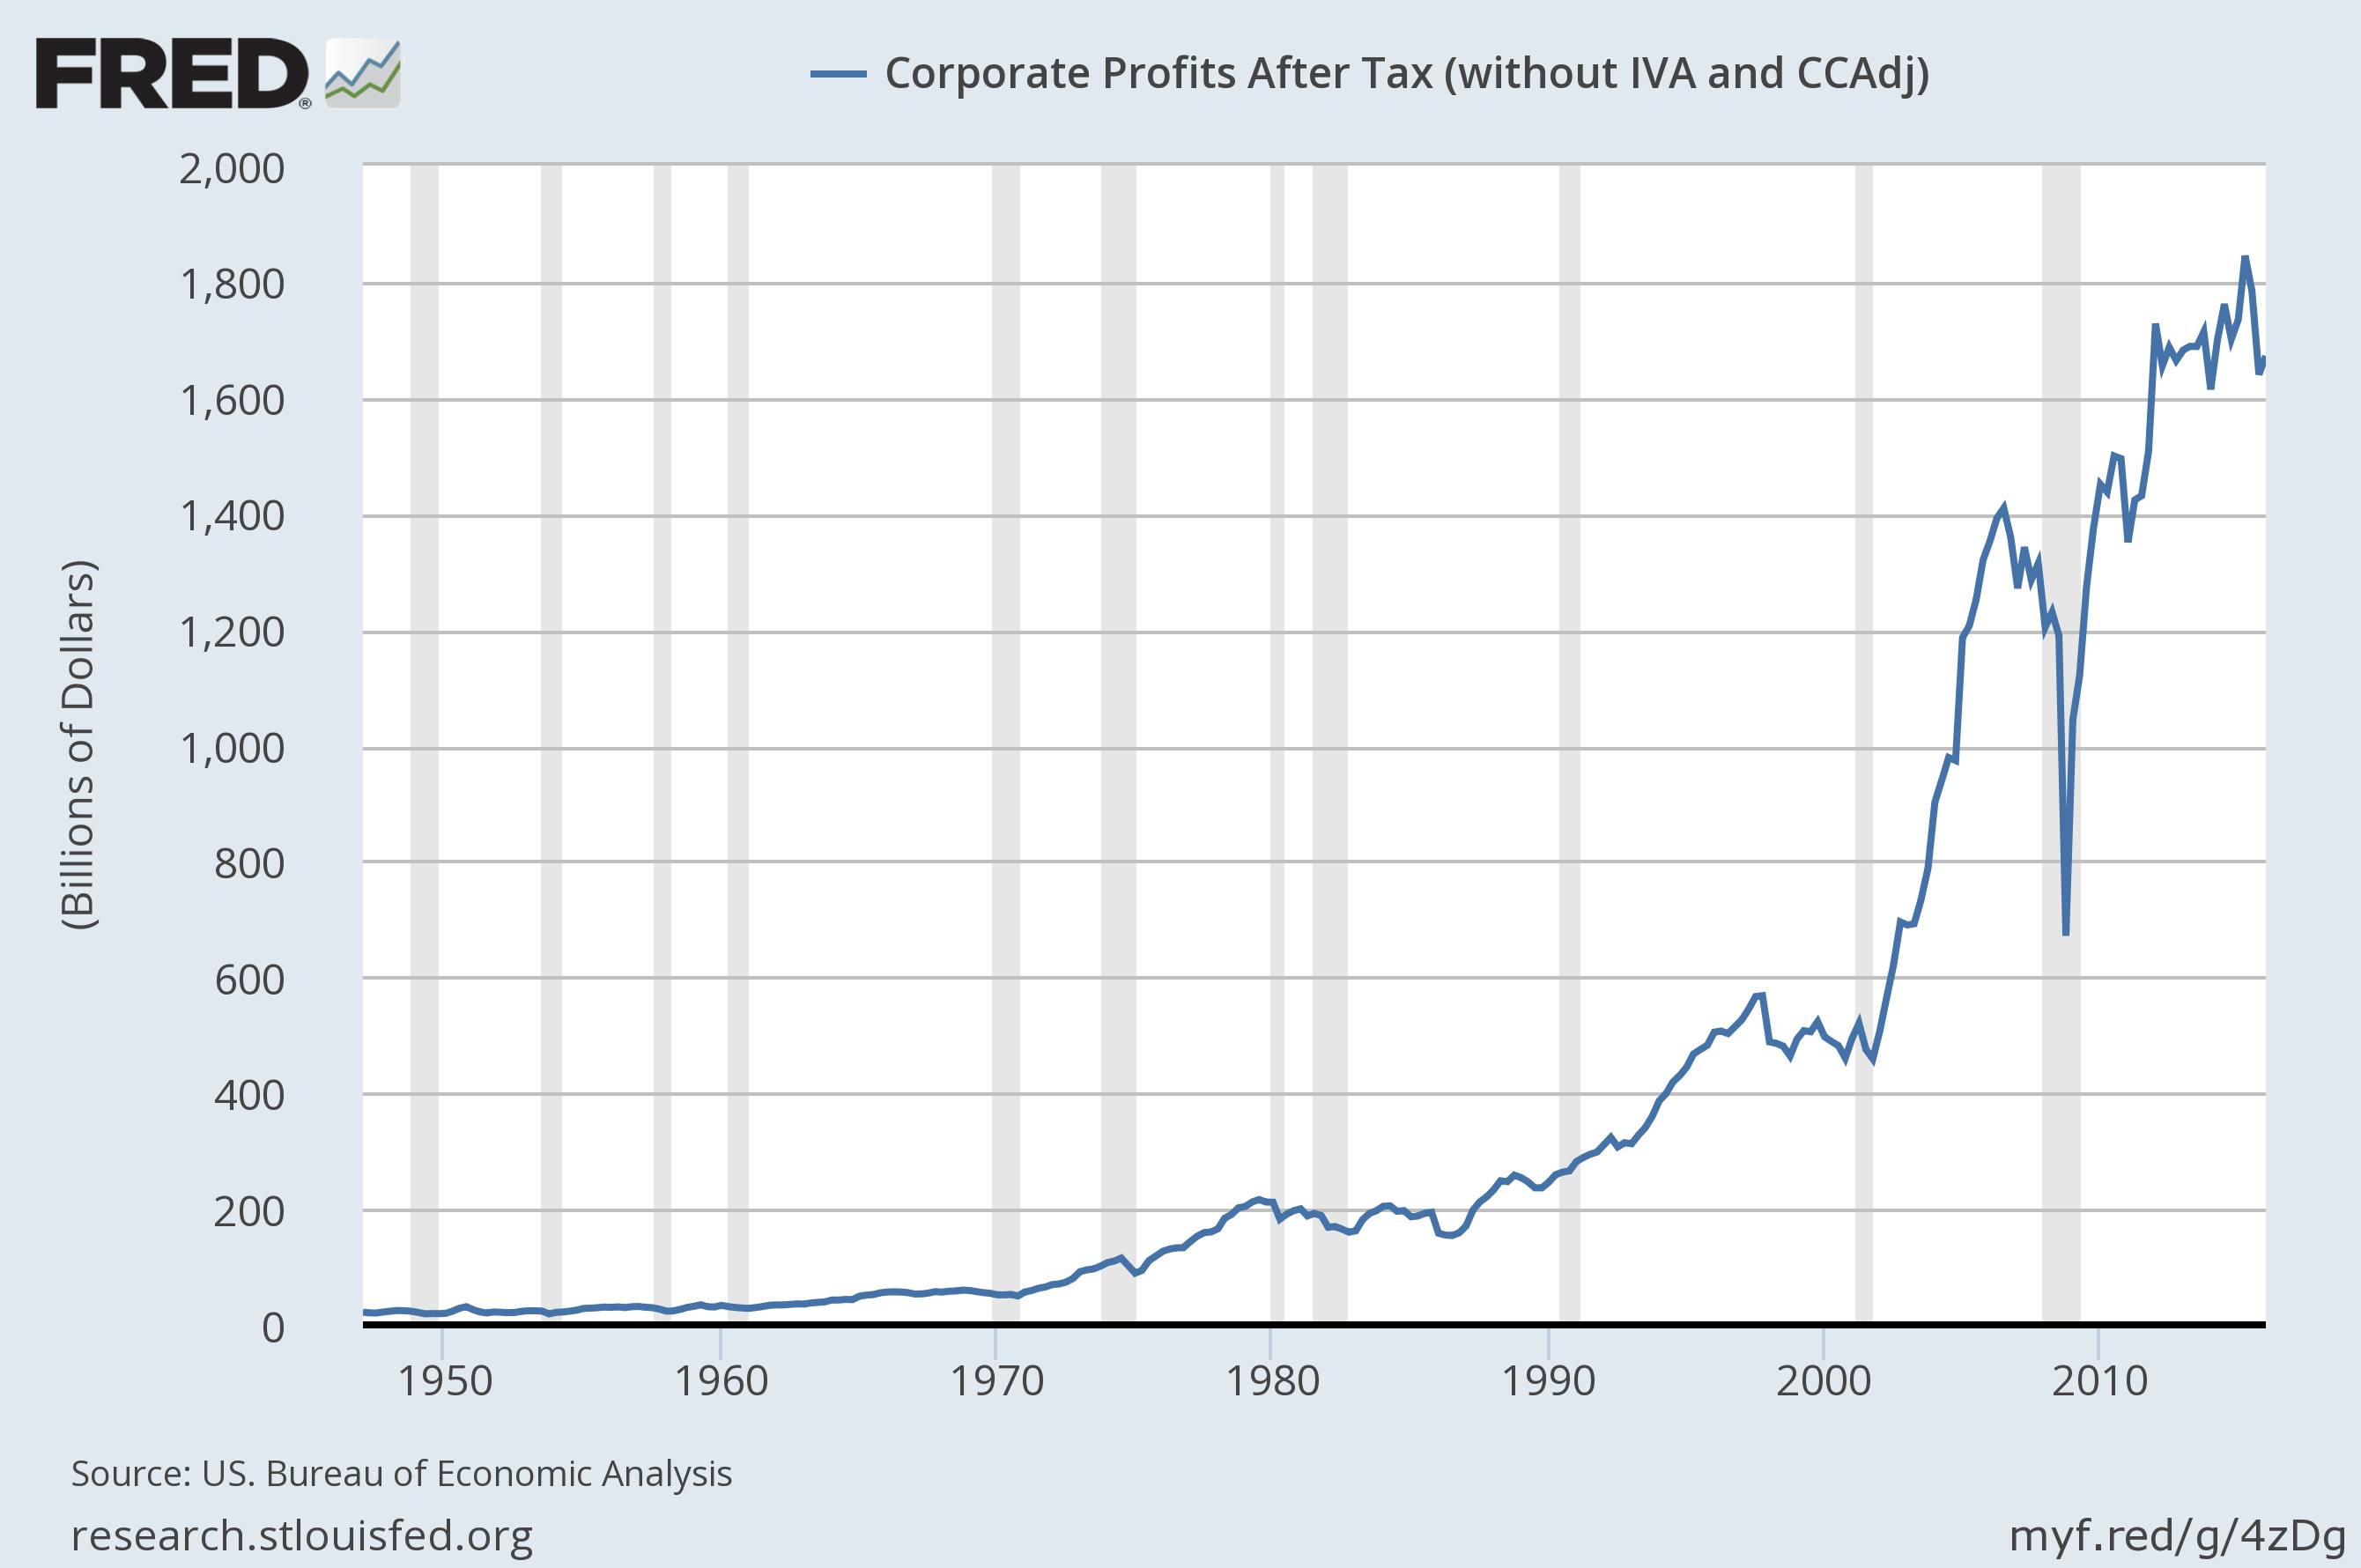
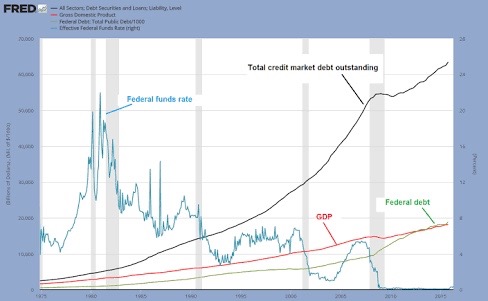
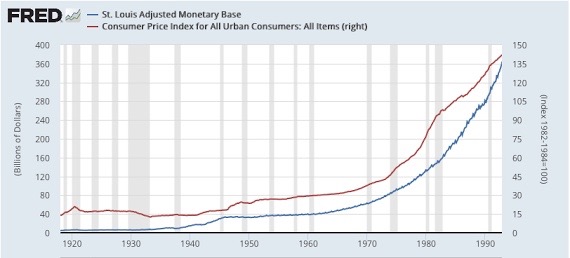
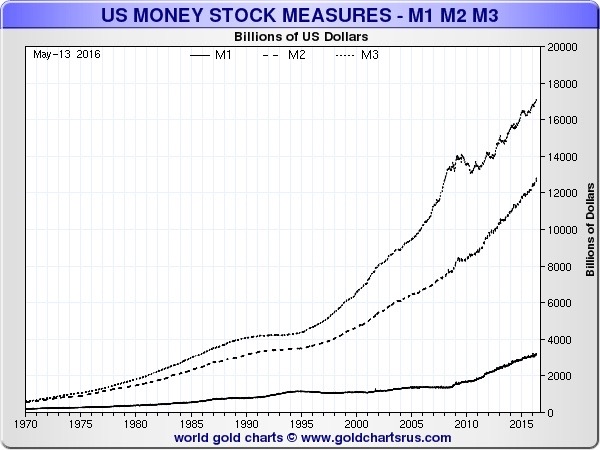
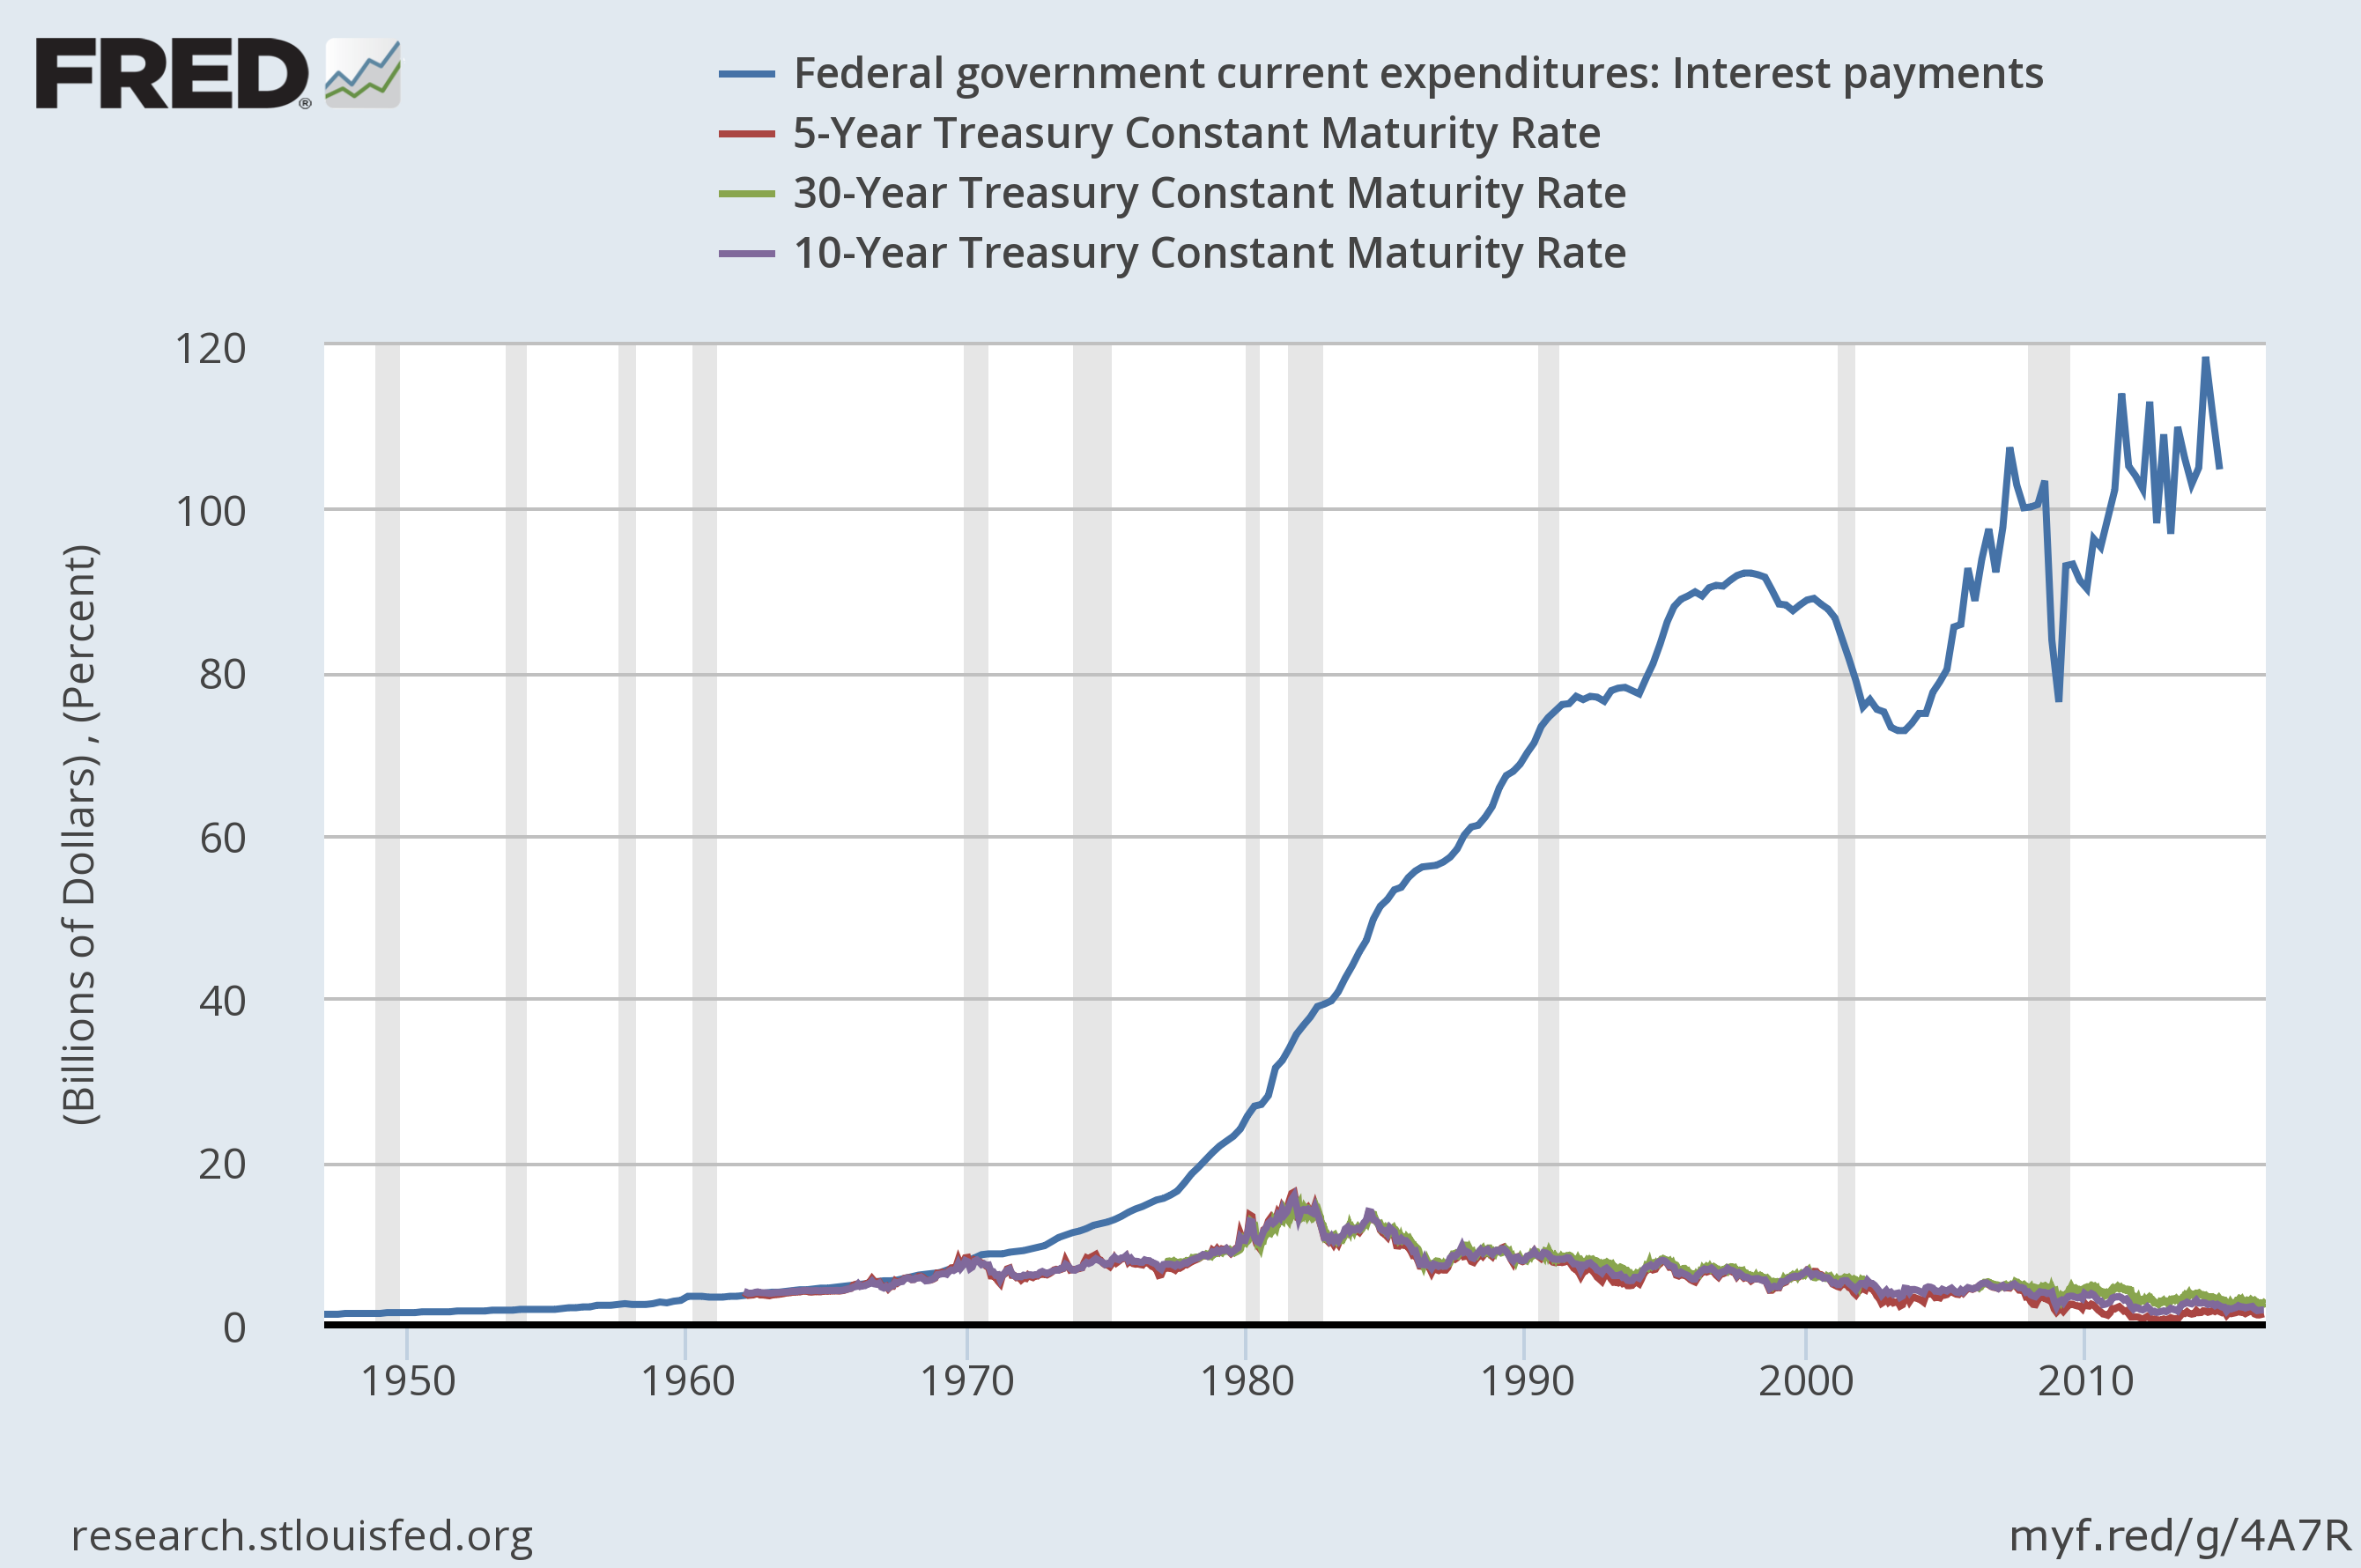
Below is a chart that shows exponential growth and the implosion after.

bankprofit  saupload_japanese_debt_service_as_percent_of_tax JHSav -60 pop ratio Food-Stamps-Annual-Benefits FEDERALRestrictions FederalRegisterFinalRulesineuality productivy

unfetteredcurrencycreation Trade deficit IMG_0610 IMG_0257 IMG_0166 IMG_0146 (2) Interest Payments Interest Rate 1950--fredgraph  IMG_0265 taxpaes japan-central-bank-balance-sheet growth-of-central-bank-balance-sheets-history-chart fed_assets_dec_15 NYSE-Margin-Debt-Chart corporate-bonds 1950--2016


IMG_0240 (1) college-tuition